

Where Bridge traffic shows up
Every governed session sends its model traffic through your LLM Gateway and its tool calls through Barndoor, so Bridge usage from every client appears in the same places as the rest of your organization’s traffic.
Bridge tags each session with its client settings version, so a change you save to client settings shows up as a new row from the next launch, or from a running session’s next hourly renewal.
The AI Agent each client’s traffic is recorded under:
Claude Desktop launched from Bridge shares the Claude Code agent and client settings with Claude Code, so the two can’t be told apart in reporting. Your policies can target these agents like any other.
With Bridge governing MCP only, model traffic doesn’t go through the LLM Gateway, so it isn’t on the LLM Usage Dashboard. With Models only, there are no Barndoor tool calls.
What doesn’t show up: what a client’s own built-in tools do on the laptop, such as a native shell command or file edit, except where it appears in the conversation sent to the model. To route those through Barndoor, see Client settings.
Launches that failed
LLM Management → Client settings lists, at the bottom, launches that failed in the last 7 days, grouped by client. Each row has the time, the user, the reason, how often it repeated, and the message the person saw. It’s the first place to look when someone says Bridge won’t launch.
Diagnose a laptop
Ask the person for two things:- Bridge’s log. In the Bridge window, Logs → Copy. On a Mac it’s also at
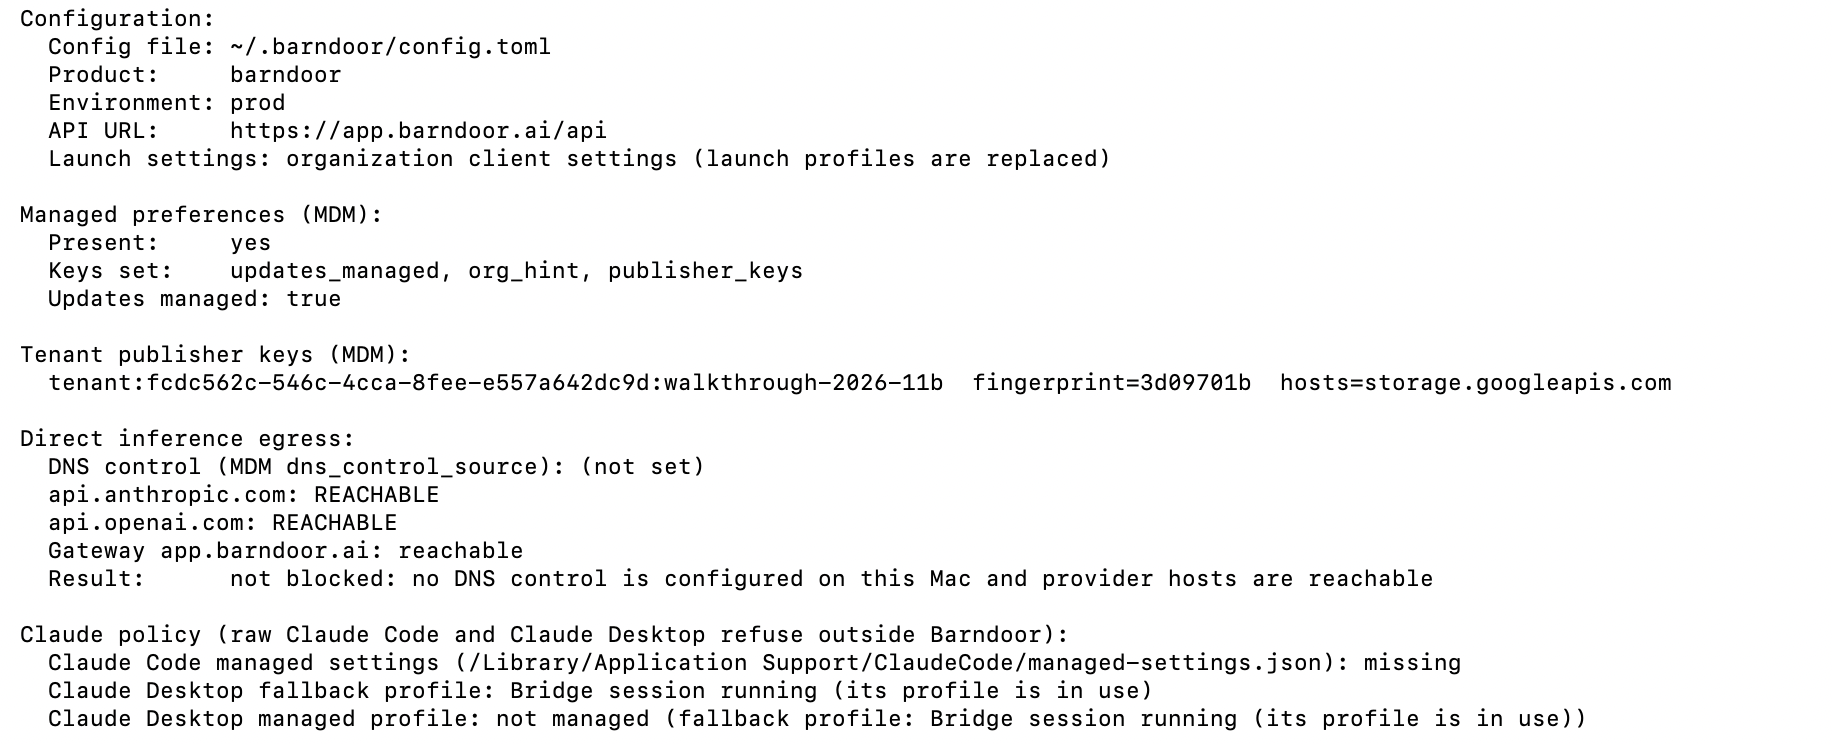
~/Library/Logs/Barndoor/gui.log; on Windows, in%LOCALAPPDATA%\Barndoor\Logs. barndoor doctorin a terminal. It shows the Bridge version, the Barndoor environment, which managed settings arrived from your MDM, whether direct access to provider APIs is blocked, whether thebarndoorcommand is Bridge’s, and the last lines of Bridge’s log.
barndoor tools test-policy --harness claude <server> <tool> on their laptop (or --harness codex), for example barndoor tools test-policy --harness claude filesystem read_text_file. Without --harness, the check ignores policies granted to a specific agent. It prints LIVE: ALLOWED or LIVE: DENIED.